Climate data guide content with tag Atmosphere
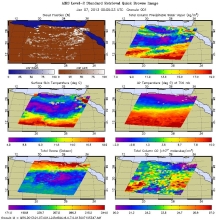 AIRS (Atmospheric InfraRed Sounder): Version 6 Level 2
Years of record
- to
AIRS Version 6 Level 2 data represent a significant improvement over AIRS Version 5 Level 2 products in terms of greater stability, yield, and quality. Several algorithmic improvements have been made by the AIRS Project in conjunction with the AIRS Science Team. Improvements include: (a) Improved soundings of Tropospheric and Sea Surface Temperatures, day and night…
Main variables and Earth System components
Atmosphere Aerosols Air Temperature CO Geopotential Height Ozone: Tropospheric Precipitable water Specific HumidityExperts contributing reviews
- N/A
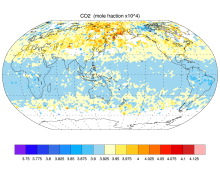 AIRS and AMSU: Trace Gases (CO2, CO, CH4, O3...); Level 3
Years of record
- N/A
AIRS provides satellite retrieval of mid-tropospheric carbon dioxide even under cloudy conditions, without the use of a priori information from models. AIRS retrievals use cloud-cleared thermal IR radiance spectra in the 15 micron band with an accuracy better than 2 ppm. AIRS retrievals have been used to produce global maps of carbon dioxide and other trace gases…
Main variables and Earth System components
Atmosphere CO Ozone: Tropospheric Biosphere CH4-Methane CO CO2-
Timestep
- Sub-daily, Daily, Monthly
-
Domain
- Global
-
Collections
- Carbon cycle
Experts contributing reviews
- N/A
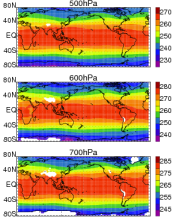 AIRS and AMSU: Tropospheric air temperature and specific humidity
Years of record
- to
The Atmospheric Infrared Sounder (AIRS) project has generated decadal-length, global, gridded data sets of temperature and specific humidity for several standard levels in the troposphere for the obs4MIPS project. This obs4MIPS version of the AIRS data are available at monthly resolution, 1ºx1º grids and formatted to facilitate easier comparisons with CMIP5 model output…
Experts contributing reviews
- Tian, Baijun
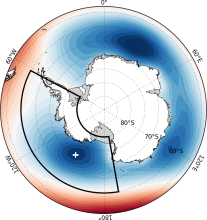 Amundsen Sea Low indices
Years of record
- to
The Amundsen Sea Low (ASL) is a climatological low pressure center located over the extreme southern Pacific Ocean, off the coast of West Antarctica. Atmospheric variability in this region is larger than anywhere else in the Southern Hemisphere, and exhibits significant correlations with both the Southern Annular Mode (SAM) and ENSO. Given its linkages to…
-
Timestep
- Monthly, Seasonal, Annual
-
Collections
- N/A
Experts contributing reviews
- Hosking, Scott
An overview of paleoclimate information from high-resolution lake sediment records: Strengths, limitations and key databases
Years of record
- N/A
Accumulated sediments at the bottom of lakes are invaluable archives of past climate and environmental change. These sediments contain a variety of physical, geochemical, and biological proxy indicators that can be used to gain a multi-faceted understanding of past conditions. Unlike other high-resolution paleoclimate archives, such as tree rings, corals, and speleothems…
Main variables and Earth System components
Atmosphere Air Temperature Precipitation Biosphere Pollen Land-
Formats
- ascii, csv, Linked Paleo Data (LiPD)
-
Timestep
- Annual, Decadal, Irregular
-
Domain
- Global
-
Collections
- N/A
Experts contributing reviews
- Larocca, Laura, Broadman, Ellie
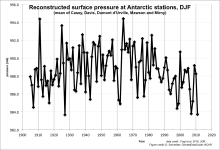 Antarctic Seasonal Pressure Reconstructions 1905-2013
Years of record
- to
This dataset consists of seasonally resolved timeseries of surface pressure at 18 Antarctic research stations, spanning 1905-2013. Routine meteorological observations began at most of these stations only around 1960, leaving a very short instrumental record on which to assess Antarctic climate variability and change. Surface pressure is one of the most…
-
Formats
- ascii, Spreadsheet
-
Timestep
- Seasonal
-
Domain
- Antarctic
-
Collections
- N/A
Experts contributing reviews
- N/A
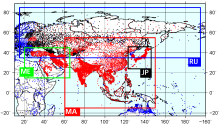 APHRODITE: Asian Precipitation - Highly-Resolved Observational Data Integration Towards Evaluation of Water Resources
Years of record
- to
APHRODITE’s (Asian Precipitation - Highly-Resolved Observational Data Integration Towards Evaluation) gridded precipitation is a set of long-term (1951 onward) continental-scale daily products that is based on a dense network of rain-gauge data for Asia including the Himalayas, South and Southeast Asia and mountainous areas in the Middle East. The gridded products are…
Experts contributing reviews
- Maeda, Mio, Yasutomi, Natsuko, Yatagai, Akiyo
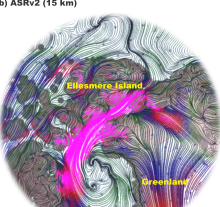 Arctic System Reanalysis (ASR)
Years of record
- to
The Arctic System Reanalysis is a multi-agency, university-led retrospective analysis (reanalysis) of the Greater Arctic. ASR is produced using high-resolution versions of the Polar Weather Forecast Model (PWRF) and the WRF-VAR and High Resolution Land Data Assimilation (HRLDAS) data assimilation systems that have been optimized for the Arctic. ASR is a comprehensive…
Experts contributing reviews
- N/A
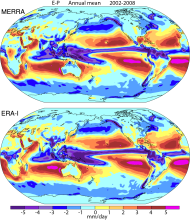 Atmospheric Reanalysis: Overview & Comparison Tables
Years of record
- N/A
Reanalysis a systematic approach to produce data sets for climate monitoring and research. Reanalyses are created via an unchanging ("frozen") data assimilation scheme and model(s) which ingest all available observations every 6-12 hours over the period being analyzed. This unchanging framework provides a dynamically consistent estimate of the climate state at each time…
Main variables and Earth System components
Atmosphere-
Formats
- N/A
-
Timestep
- N/A
-
Domain
- N/A
Experts contributing reviews
- Dee, Dick, Fasullo, John, Shea, Dennis, Walsh, John
 Budgets: Mass, Moisture, Energy
Years of record
- N/A
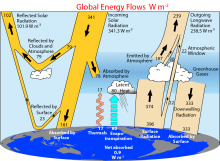
The uneven distribution of incoming and outgoing radiation is the primary driver of the climate system. The resulting flows of energy by the climate components (atmosphere, ocean, ice, etc) determine the climate. Ultimately, the net difference between incoming and outgoing radiation determines if the climate is changing. Hence, estimating and understanding energy…
Main variables and Earth System components
Atmosphere Budget Evaporation Evaporation-Precipitation Radiation-
Formats
- N/A
-
Timestep
- N/A
-
Domain
- N/A
-
Collections
- Climate Analysis Section (CAS) Data Catalog
Experts contributing reviews
- N/A
 CALIPSO
Years of record
- to
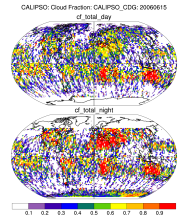
CALIPSO (Cloud-Aerosol Lidar and Infrared Pathfinder Satellite Observations ) was launched on April 28, 2006 to study the impact of clouds and aerosols on the Earth's radiation budget and climate. It flies in formation with five other satellites in the international "A-Train" constellation for coincident Earth observations. The CALIPSO satellite comprises three…
Experts contributing reviews
- N/A
 Canadian Forest Fire Weather Index (FWI)
Years of record
- N/A
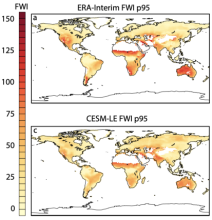
Fire weather indices are used to quantify the meteorological conditions that can lead to fire ignition and spread. They are used to communicate fire danger levels to emergency and fire fighting management, as well as the public on short time scales, and also for understanding long-term changes in fire regimes or wildfire risk. Several fire weather indices exist, each…
Main variables and Earth System components
Atmosphere-
Formats
- N/A
-
Timestep
- N/A
-
Domain
- N/A
-
Collections
- N/A
Experts contributing reviews
- Touma, Danielle
 CCMP: Cross-Calibrated Multi-Platform wind vector analysis
Years of record
- to
The CCMP wind analysis is a near-global, high spatial and temporal resolution gridded dataset of surface wind vectors spanning 1987-present. The input data are a combination of inter-calibrated satellite data from numerous radiometers and scatterometers and in-situ data from moored buoys. An algorithm finds a best-fit solution to all of the available…
Experts contributing reviews
- Ricciardulli, Lucrezia
 CERA-20C: ECMWF's Coupled Ocean-Atmosphere Reanalysis of the 20th Century
Years of record
- to
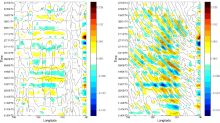
The CERA-20C is a global, coupled reanalysis spanning 1901-2010 with a focus on low-frequency climate variability. Similar to ERA-20C, the surface observations assimilated include surface pressures from the International Surface Pressure Databank v3.2.6 and ICOADS v 2.5.1, and surface winds over the oceans from ICOADSv2.5.1. Upper-air and satellite data are…
Main variables and Earth System components
Atmosphere Multiple variables Cryosphere Sea Ice Concentration OceanExperts contributing reviews
- Laloyaux, Patrick
 CERES EBAF: Clouds and Earth's Radiant Energy Systems (CERES) Energy Balanced and Filled (EBAF)
Years of record
- to
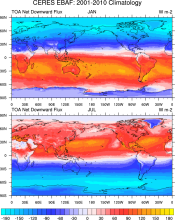
The CERES-EBAF product provides 1-degree regional, zonal and global monthly mean Top-of-Atmosphere (TOA) and surface (SFC) longwave (LW), shortwave (SW), and net (NET) fluxes under clear and all-sky conditions. EBAF is used for climate model evaluation, estimating the Earth's global mean energy budget, and to infer meridional heat transport. The data synthesized to…
Experts contributing reviews
- Loeb, Norman
 CHELSA high-resolution land surface temperature and precipitation
Years of record
- to
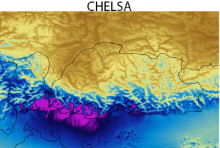
The Climatologies at high resolution for the Earth's land surface (CHELSA) dataset contains high spatial resolution monthly climatologies of mean, maximum and minimum temperatures and mean precipitation, representing the period 1979-2013. CHELSA is essentially a statistical downscaling of the ERA-Interim reanalysis, with the temperature downscaling based on mean…
Experts contributing reviews
- Karger, Dirk
 CHIRPS: Climate Hazards InfraRed Precipitation with Station data (version 2)
Years of record
- to
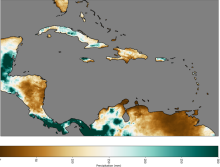
Climate Hazards Group InfraRed Precipitation with Station data (CHIRPS) is a quasi-global (50S - 50N), land-only rainfall dataset with a range of temporal and spatial resolutions depending on the region and the time period. Data can be found at 0.05 deg or 0.1 deg resolution, and can be found at 6-hourly to seasonal time scales. These resolutions are regionally dependent…
Experts contributing reviews
- Touma, Danielle, Martinez, Carlos
 CLARA-A1: Cloud properties, surface albedo and surface radiation products based on AVHRR
Years of record
- to
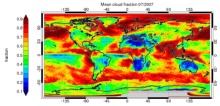
"CLARA-A1 (CLoud, Albedo and RAdiation dataset, AVHRR-based, version 1) is a global dataset of cloud properties, surface albedo and surface radiation products, generated by the EUMETSAT Satellite Application Facility on Climate Monitoring (CM SAF). The products are derived from measurements of the Advanced Very High Resolution Radiometer (AVHRR) onboard the polar…
Main variables and Earth System components
Atmosphere Cloud Properties Liquid Water Path Radiation Surface albedo-
Formats
- netCDF
-
Timestep
- Daily, Monthly, Pentad
-
Domain
- Global
-
Collections
- Climate Data Record
Experts contributing reviews
- Stengel, Martin
 Climate Forecast System Reanalysis (CFSR)
Years of record
- to
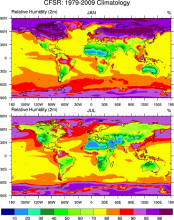
The CFSR is a third generation reanalysis product. It is a global, high resolution, coupled atmosphere-ocean-land surface-sea ice system designed to provide the best estimate of the state of these coupled domains over this period. The CFSR includes (1) coupling of atmosphere and ocean during the generation of the 6 hour guess field, (2) an interactive sea-ice model, and…
Main variables and Earth System components
Atmosphere Air Temperature Geopotential Height Precipitable water Ocean-
Formats
- GRIB
-
Timestep
- Sub-daily, Monthly
-
Domain
- Global
-
Collections
- Climate Analysis Section (CAS) Data Catalog
Experts contributing reviews
- N/A
 Cloud Dataset Overview
Years of record
- to
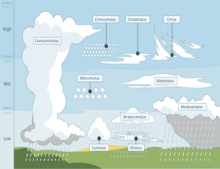
Clouds cover about 70% of the earth's surface. They are important components of the cliimate's water and energy budgets. Historically, cloud reports have come from station or ship observations. The satellite observation era, beginning in the 1980’s and spanning now more than 30 years, allows to capture clouds and their properties over the entire globe and across a…
-
Formats
- N/A
-
Timestep
- Climatology, Monthly
-
Domain
- Global
-
Collections
- Overview / Comparison page
Experts contributing reviews
- Stubenrauch, Claudia
 Cloud observations from MODIS
Years of record
- to
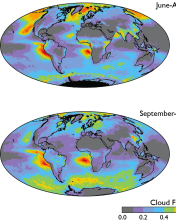
The Moderate Resolution Imaging Spectroradiometer (MODIS) is scanning instrument that makes measurements in 36 spectral bands from the visible to the thermal infrared at spatial resolutions from 250 m to 1 km. There are MODIS instruments aboard two sun-synchronous polar-orbiting NASA satellites: Terra, which has a daytime equatorial crossing at about 10:30 am local time…
-
Timestep
- Daily, Monthly, Weekly
-
Domain
- Global
-
Collections
- Diagnostic Data Sets, NCAR-DOE-CESM, atmosdiagnostics, Obs4MIPS
Experts contributing reviews
- Pincus, Robert
 CloudSat
Years of record
- to
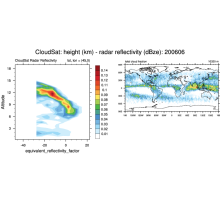
CloudSat is a satellite mission designed to measure the vertical structure of clouds from space. The radar data produces detailed images of cloud structures. CloudSat is one of a constellation of satellites known as the A-Train (Cloudsat, CALIPSO, PARASOL, Aqua, Aura, GCOM-W1). The satellites fly in a nearly circular orbit with an equatorial altitude of approximately…
Experts contributing reviews
- N/A
 CMAP: CPC Merged Analysis of Precipitation
Years of record
- to
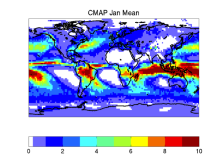
CMAP refers to a collection of precipitation data sets, though the 2.5°x2.5° global monthly version is probably the most widely used. This data set is constructed from an analysis of gauge data and satellite-derived precipitation estimates. An "enhanced" version (CMAP/A) is also available, which provides global coverage by filling in gaps with precipitation forecasts…
-
Timestep
- Monthly, Pentad
-
Domain
- Global
Experts contributing reviews
- Arkin, Phil, Xie, PIngping
 CMORPH (CPC MORPHing technique): High resolution precipitation (60S-60N)
Years of record
- to
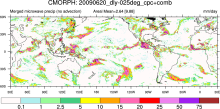
"CMORPH (CPC MORPHing technique) produces global precipitation analyses at very high spatial and temporal resolution. This technique uses precipitation estimates that have been derived from low orbiter satellite microwave observations exclusively, and whose features are transported via spatial propagation information that is obtained entirely from geostationary satellite…
Experts contributing reviews
- N/A
 Combined CloudSat spaceborne radar and CALIPSO spaceborne lidar cloud fraction dataset (3S-GEOPROF-COMB)
Years of record
- to
A global (82S-82N) cloud fraction data set, providing a unique view of cloud vertical structure, has been developed based on the complimentary spaceborne remote sensing capabilities of the CloudSat radar and the CALISPSO lidar. The data set provides monthly mean cloud fraction over several vertical layers for 2006-2019.
-
Formats
- netCDF
-
Timestep
- Monthly, Seasonal, Annual
-
Domain
- Global
-
Collections
- Diagnostic Data Sets, NCAR-DOE-CESM, atmosdiagnostics
Experts contributing reviews
- Bertrand, Leah, Kay, Jennifer
 Coral geochemical records: An overview of their use as climate proxies and of available databases
Years of record
- N/A
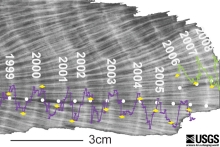
Coral records are one of the main types of high-resolution (annual to sub-annual) paleoclimate proxies, providing timeseries of environmental conditions reaching hundreds to thousands of years into the past in the tropics, the central driver of the global atmospheric circulation. As such, corals complement paleoclimate records from the largely mid-latitude tree-…
Main variables and Earth System components
Atmosphere Evaporation Evaporation-Precipitation Precipitation Ocean Salinity SST - sea surface temperature-
Formats
- ascii, HTML Table, Linked Paleo Data (LiPD), Matlab
-
Timestep
- N/A
-
Domain
- Atlantic Ocean, Indian Ocean, Pacific Ocean, Tropics
-
Collections
- N/A
Experts contributing reviews
- Lawman, Allison
 COREv2 Air-Sea Surface Fluxes
Years of record
- to
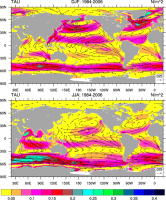
The Coordinated Ocean Research Experiments version 2 (COREv2) data set consists of a globally complete set of air-sea fluxes of momentum, heat and freshwater for 1948-2009 at monthly resolution. This data set serves as a set of common atmospheric boundary conditions that has been used by the ocean modeling community to force and compare a diverse set of…
Main variables and Earth System components
Atmosphere Evaporation Precipitation Radiation Wind Stress Land Runoff and Streamflow Ocean Surface Flux-
Formats
- netCDF
-
Timestep
- Monthly
-
Domain
- Global
-
Collections
- Diagnostic Data Sets, NCAR-DOE-CESM, atmosdiagnostics, oceandiagnostics
Experts contributing reviews
- Yeager, Stephen
 COSP: Cloud Feedback Model Intercomparison Project (CFMIP) Observation Simulator Package
Years of record
- N/A
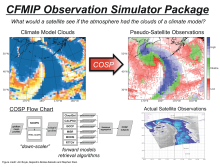
Cloud processes and feedbacks are recognized as the largest uncertainty in climate model projections of climate change. Progress in understanding the roles of clouds in climate change has in part been hampered by the lack of a consistent definition of clouds and cloud types in models and observations. It has been difficult to compare model output to observations, or even…
-
Formats
- N/A
-
Timestep
- N/A
-
Domain
- Global
-
Collections
- Diagnostic Data Sets, NCAR-DOE-CESM, atmosdiagnostics
Experts contributing reviews
- Kay, Jennifer
 CPC Unified Gauge-Based Analysis of Global Daily Precipitation
Years of record
- to
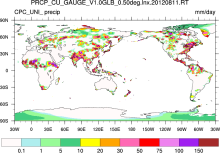
A gauge-based analysis of daily precipitation has been constructed over the global land areas. Gauge reports from over 30,000 stations are collected from multiple sources including GTS, COOP, and other national and international agencies. Quality control is performed through comparisons with historical records and independent information from measurements at nearby…
Experts contributing reviews
- N/A
 CRU TS Gridded precipitation and other meteorological variables since 1901
Years of record
- to
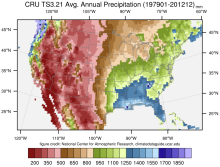
The CRU TS series of data sets (CRU TS = Climatic Research Unit Time series) contain gridded monthly fields of precipitation, daily maximum and minimum temperatures, cloud cover, and other variables covering Earth's land areas for 1901-2022 (CRU TS4.0 is the recent major release). The data set is gridded to 0.5x0.5 degree resolution, based on analysis of over 4000…
Main variables and Earth System components
Atmosphere Air Temperature Cloud Properties Maximum Air Temperature Minimum Air Temperature Potential Evapotranspiration PrecipitationExperts contributing reviews
- N/A
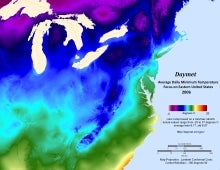 Daymet: Daily Surface Weather and Climatological Summaries
Years of record
- to
Daymet provides long-term, continuous, gridded estimates of daily weather and climatology variables by interpolating and extrapolating ground-based observations through statistical modeling techniques. The Daymet data products provide driver data for biogeochemical terrestrial modeling and have myriad applications in many Earth science, natural resource, biodiversity,…
Main variables and Earth System components
Atmosphere Maximum Air Temperature Minimum Air Temperature Precipitation Radiation Water Vapor Cryosphere Snow Water Equivalent-
Timestep
- Climatology, Daily
-
Domain
- North America
-
Collections
- N/A
Experts contributing reviews
- Thornton, Peter E
 E-OBS: High-resolution gridded mean/max/min temperature, precipitation and sea level pressure for Europe & Northern Africa
Years of record
- to
E-OBS is a high spatial resolution daily gridded data that covers the European region and is based on the station data collated by the ECA&D initiative (Klein Tank et al., 2002). These data are supplied by many European National Meteorological Services and other data providers across Europe and the Middle East. The dataset spans the period 1 January 1950 to the…
Main variables and Earth System components
Atmosphere Air Temperature Maximum Air Temperature Minimum Air Temperature Precipitation Sea Level PressureExperts contributing reviews
- van der Schrier, Gerard
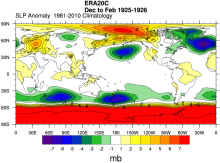 ERA-20C: ECMWF's atmospheric reanalysis of the 20th century (and comparisons with NOAA's 20CR)
Years of record
- to
The ECMWF's first atmospheric reanalysis of the 20th Century, ERA-20C, provides a long, gridded dataset of many climate variables, spanning 1900-2010. Observations assimilated include surface pressures from the International Surface Pressure Databank v3.2.6 and ICOADS v 2.5.1, and surface winds over the oceans from ICOADSv2.5.1. Upper-air and satellite data…
-
Timestep
- Sub-daily, Daily, Monthly
-
Domain
- Global
Experts contributing reviews
- Poli, Paul
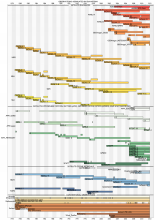 ERA-Interim
Years of record
- to
Using a much improved atmospheric model and assimilation system from those used in ERA-40, ERA-Interim represents a third generation reanalysis. Several of the inaccuracies exhibited by ERA-40 such as too-strong precipitation over oceans from the early 1990's onwards and a too-strong Brewer-Dobson circulation in the stratosphere, were eliminated or significantly reduced…
Main variables and Earth System components
Atmosphere Air Temperature Geopotential Height Precipitable water Precipitation-
Timestep
- Sub-daily, Daily, Monthly
-
Domain
- Global
Experts contributing reviews
- Dee, Dick
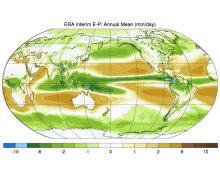 ERA-Interim: derived components
Years of record
- to
Era-Interim data are used to derive monthly mass, moisture and energy budget products. Each term is available. Atmospheric energy, mass, and moisture budgets can be computed by vertically integrating reanalysis fields and employing suitable corrections (e.g. mass). The budgets are uniquely valuable for interpreting the climate's mean state and its variability. They can…
-
Formats
- netCDF
-
Timestep
- Monthly
-
Domain
- Global
-
Collections
- Climate Analysis Section (CAS) Data Catalog
Experts contributing reviews
- N/A
 ERA5 atmospheric reanalysis
Years of record
- to
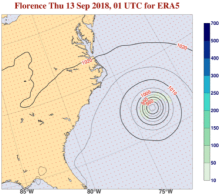
ERA5, the successor to ERA-Interim, provides global, hourly estimates of atmospheric, ocean-wave and land-surface variables, at a horizontal resolution of 31 km and 137 levels in the vertical from the surface to 0.01 hPa (about 80km). Produced by ECMWF on behalf of the European Union’s Copernicus Climate Change Service (C3S), ERA5 extends from 1940 onwards. Each day one…
-
Timestep
- Sub-daily, Daily, Monthly
-
Domain
- Global
-
Collections
- Diagnostic Data Sets
Experts contributing reviews
- Hersbach, Hans
 Extended Edited Synoptic Cloud Reports Archive (EECRA) from Ships and Land Stations Over the Globe
Years of record
- to
"The Extended Edited Synoptic Cloud Reports Archive makes use of routine synoptic observations made by humans on ships over the ocean and at weather stations over land. Following the synoptic code (WMO, 1974), observers report the fraction of sky dome covered by all clouds, the fraction of sky dome covered by clouds in the lowest layer, the cloud type at low, mid, and…
Experts contributing reviews
- Norris, Joel
 GHCN-D: Global Historical climatology Network daily temperatures
Years of record
- to
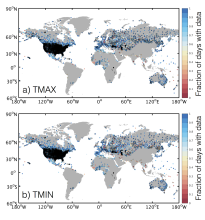
The Global Historical Climatology Network Daily database, GHCN-D, contains meteorological measurements from over 90,000 stations across the globe. The majority of station records contain precipitation data only, however other key variables including maximum temperature, minimum temperature, snowfall, cloudiness, wind speed and snow depth are available at many…
Main variables and Earth System components
Atmosphere Maximum Air Temperature Minimum Air Temperature PrecipitationExperts contributing reviews
- McKinnon, Karen
 GHCNDEX: Gridded Temperature and Precipitation Climate Extremes Indices (CLIMDEX data)
Years of record
- to
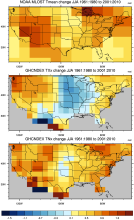
GHCNDEX provides gridded, station-based indices of temperature- and precipitation- related climate extremes. It is intended for climate change detection and attribution studies, climate model evaluation, and operational monitoring of extreme climatic events. Twenty-six indices, including daily maximum and minimum temperatures, number of frost days, maximum 1-day…
Main variables and Earth System components
Atmosphere Maximum Air Temperature Minimum Air Temperature Land Freeze/ThawExperts contributing reviews
- N/A
 Global (land) precipitation and temperature: Willmott & Matsuura, University of Delaware
Years of record
- to
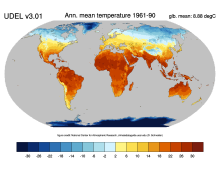
A series of gridded temperature and precipitation data sets. Station records that served as bases for the Terrestrial Air Temperature: 1900-2014 Gridded Monthly Time Series (Version 4.01) and Terrestrial Precipitation: 1900-2014 Gridded Monthly Time Series (Version 4.01) archives are used here to help create new gridded climatologies of monthly and annual average air…
Main variables and Earth System components
Atmosphere Air Temperature Air Temperature at 2m Precipitation-
Timestep
- Climatology, Monthly
-
Domain
- Global
-
Collections
- Diagnostic Data Sets, NCAR-DOE-CESM, atmosdiagnostics
Experts contributing reviews
- Matsuura, Kenji
 Global high-resolution precipitation: MSWEP
Years of record
- to
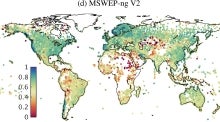
Multi-Source Weighted-Ensemble Precipitation (MSWEP) is a sub-daily precipitation dataset with full global coverage at 0.1° resolution, spanning the period 1979 to present. It is updated in near real-time with a latency of three hours, making it suitable for operational applications and for taking a quick look at recent anomalous precipitation events and placing…
Experts contributing reviews
- Beck, Hylke
 Global land-ocean surface temperature data: HadCRUT5
Years of record
- to
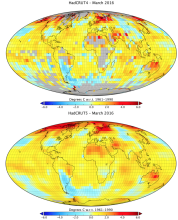
HadCRUT5 is one of the main datasets used to monitor global and regional surface temperature variability and trends. It is a global surface temperature product that combines land surface air temperatures from CRUTEM5 with SSTs from HadSST4. HadCRUT5 is a departure from its predecessors (HadCRUT4, HadCRUT3, etc.) in that two different versions are offered. Both versions…
Main variables and Earth System components
Atmosphere Air Temperature at 2m Ocean SST - sea surface temperature-
Formats
- netCDF
-
Timestep
- Monthly
-
Domain
- Global
-
Collections
- Diagnostic Data Sets
Experts contributing reviews
- Hausfather, Zeke
 Global near-surface humidity data: HadISDH
Years of record
- to
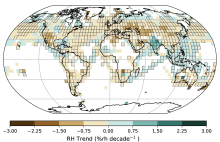
HadISDH (Met Office Hadley Centre International Surface Dataset of Humidity) is a gridded 5°x5° monthly mean product beginning in January 1973, and updated annually. It provides monthly gridded specific humidity (q), relative humidity (RH), vapor pressure (e), dew point temperature (Td), wet-bulb temperature (Tw), dew point depression (DPD), equivalent temperature (Te),…
Main variables and Earth System components
Atmosphere Air Temperature at 2m Relative Humidity Specific HumidityExperts contributing reviews
- Willett, Kate
 Global surface temperature data: GISTEMP: NASA Goddard Institute for Space Studies (GISS) Surface Temperature Analysis
Years of record
- to
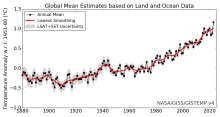
NASA Goddard's Global Surface Temperature Analysis (GISTEMP) combines land surface air temperatures from GHCN-M version 4 with SSTs of the ERSSTv5 analysis into a comprehensive, global surface temperature data set spanning 1880 to the present at monthly resolution, on a 2x2 degree latitude-longitude grid. As such, it is one of the main data sets used to monitor global…
Main variables and Earth System components
Atmosphere Air Temperature Ocean SST - sea surface temperature-
Timestep
- Monthly
-
Domain
- Global
Experts contributing reviews
- Lenssen, Nathan
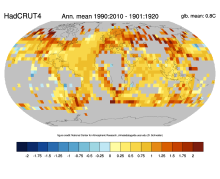 Global surface temperature data: HadCRUT4 and CRUTEM4
Years of record
- to
Extending back to 1850 and frequently updated, HadCRUT4 is the longest data set of its type. HadCRUT4 is a combination of the global land surface temperature data set, CRUTEM4 and the global SST data set, HadSST3. HadCRUT4 is different from the most closely comparable products (e.g. NASA GISTEMP and NOAA MLOST) in that no interpolation is performed. As such, there are…
Main variables and Earth System components
Atmosphere Air Temperature Ocean SST - sea surface temperature-
Timestep
- Climatology, Monthly
-
Domain
- Global
Experts contributing reviews
- N/A
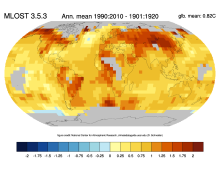 Global surface temperature data: MLOST: NOAA Merged Land-Ocean Surface Temperature Analysis
Years of record
- to
NOAA's Merged Land-Ocean Surface Temperature Analysis (MLOST) combines land surface air temperatures primarily from the Global Historical Climatology Network, Monthly (GHCN-M) version 3 with SSTs of the ERSSTv3b analysis into a comprehensive global surface temperature data set spanning 1880 to the present at monthly resolution, on a 5x5 degree latitude-longitude grid. As…
Main variables and Earth System components
Atmosphere Air Temperature Ocean SST - sea surface temperature-
Timestep
- Monthly
-
Domain
- Global
Experts contributing reviews
- N/A
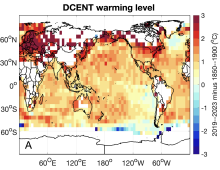 Global surface temperature data: The Dynamically Consistent ENsemble of Temperature (DCENT)
Years of record
- to
The Dynamically Consistent ENsemble of Temperature (DCENT) provides monthly, global, gridded, surface temperature anomalies since 1850. This product provides combined land surface air temperature (LSAT) and sea surface temperature (SST) anomalies at monthly 5° x 5° resolution. An important feature of DCENT is that both land and ocean measurements are used when bias-…
Main variables and Earth System components
Atmosphere Air Temperature at 2m Ocean SST - sea surface temperatureExperts contributing reviews
- N/A
 Global surface temperature: Maximum Likelihood Estimates of Temperatures using HadCRUT5 (Version 1.2)
Years of record
- to
The Maximum Likelihood Estimates of Temperatures using HadCRUT5 Version 1.2 (HadCRU_MLE_v1.2) dataset provides global complete surface temperature estimates since 1850, with monthly 5°x5° resolution. It uses more sophisticated statistical models to fill data gaps in the non-infilled version of HadCRUT5. The statistical models used in HadCRU_MLE_v1.2 better…
Main variables and Earth System components
Atmosphere Air Temperature at 2m Ocean SST - sea surface temperatureExperts contributing reviews
- Chan, Duo
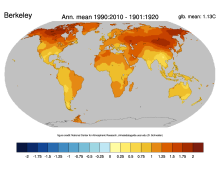 Global surface temperatures: BEST: Berkeley Earth Surface Temperatures
Years of record
- to
The Berkeley Earth Surface Temperatures (BEST) are a set of data products, originally a gridded reconstruction of land surface air temperature records spanning 1701-present, and now including an 1850-present merged land-ocean data set that combines the land analysis with an interpolated version of HadSST3. The land station data are available in an archive, and…
Main variables and Earth System components
Atmosphere Air Temperature Maximum Air Temperature Minimum Air Temperature Ocean SST - sea surface temperatureExperts contributing reviews
- Cowtan, Kevin
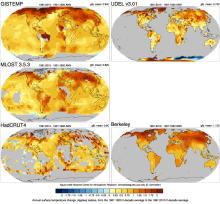 Global Temperature Data Sets: Overview & Comparison Table
Years of record
- to
Global surface temperature data sets are an essential resource for monitoring and understanding climate variability and climate change. The most commonly used data sets combine historical observations of near surface air temperatures at land stations with global data sets of sea surface temperatures (SST) obtained from a changing mix of ship-based and buoy measurements.…
Main variables and Earth System components
Atmosphere Air Temperature Air Temperature at 2m Ocean SST - sea surface temperature-
Timestep
- Climatology, Monthly
-
Domain
- Global
-
Collections
- Overview / Comparison page
Experts contributing reviews
- N/A
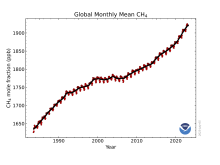 Global-mean methane at the Earth's surface from NOAA’s global cooperative greenhouse gas measurements
Years of record
- to
NOAA’s Global Monitory Laboratory has measured atmospheric methane levels since 1983 at a global cooperative greenhouse gases sampling network, which currently includes more than 50 sites. This measurement network is unique among greenhouse gases monitoring programs with its global coverage and long-term records. It aims to track the atmospheric abundances of long-lived…
Experts contributing reviews
- Lan, Xin
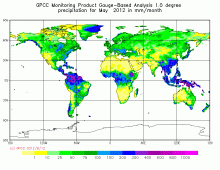 GPCC: Global Precipitation Climatology Centre
Years of record
- to
The GPCC provides gridded gauge-analysis products derived from quality controlled station data. Two products are for climate: (a) the Full Data Reanalysis Product (1901-2010) is recommended for global and regional water balance studies, calibration/validation of remote sensing based rainfall estimations and verification of numerical models, and (b) the VASClimO 50-…
-
Timestep
- Climatology, Daily, Monthly
-
Domain
- Global
Experts contributing reviews
- N/A
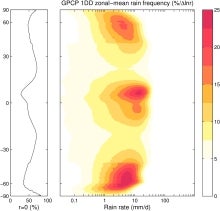 GPCP (Daily): Global Precipitation Climatology Project
Years of record
- to
The 1DD product provides precipitation estimates on a 1-degree grid over the entire globe at 1-day (daily) for the period October 1996 - present. Both the Pentad and 1DD products are consistent with the Version 2 monthly product in the sense that the Pentad and 1DD approximately sum to the monthly SG estimate. All three precipitation products are produced by optimally…
Experts contributing reviews
- Pendergrass, Angeline
 GPCP (Monthly): Global Precipitation Climatology Project
Years of record
- to
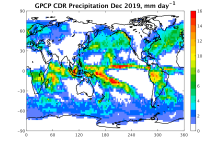
Data from rain gauge stations, satellites, and sounding observations have been merged to estimate monthly rainfall on a 2.5-degree global grid from 1979 to the present. The careful combination of satellite-based rainfall estimates provides the most complete analysis of rainfall available to date over the global oceans, and adds necessary spatial detail to the rainfall…
-
Timestep
- Climatology, Monthly
-
Domain
- Global
Experts contributing reviews
- Pendergrass, Angeline, Wang, Jian-Jian
 Gridded Climatology of Clouds from Surface Observations Worldwide (1971-2008)
Years of record
- to
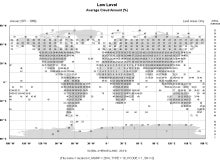
This digital archive provides multi-year monthly, seasonal, and annual averages in 5x5-degree grid boxes (or 10x10-degree boxes for some quantities over the ocean). Daytime and nighttime averages, as well as the diurnal average (average of day and night), are given. Nighttime averages were computed using only those reports that met an "illuminance criterion" (i.e., made…
-
Formats
- ascii
-
Timestep
- Climatology, Monthly, Seasonal
-
Domain
- Global
-
Collections
- Diagnostic Data Sets, NCAR-DOE-CESM, atmosdiagnostics
Experts contributing reviews
- Norris, Joel
 HadEX2: Gridded Temperature and Precipitation Climate Extremes Indices (CLIMDEX data)
Years of record
- to
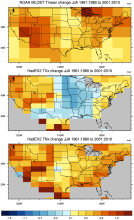
Note: HadEX2 has been superseded by HadEX3. HadEX2 provides gridded, station-based indices of temperature- and precipitation- related climate extremes. It is intended for climate change detection and attribution studies and climate model evaluation. Twenty-nine indices, including daily maximum and minimum temperatures, number of frost days, maximum 1-day precipitation,…
Main variables and Earth System components
Atmosphere Maximum Air Temperature Minimum Air Temperature Land Freeze/ThawExperts contributing reviews
- N/A
 HadEX3: Gridded Temperature and Precipitation Climate Extremes Indices (CLIMDEX data)
Years of record
- to
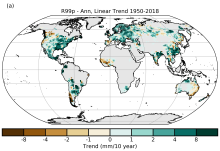
HadEX3 provides gridded, station-based indices of temperature- and precipitation- related climate extremes and supersedes HadEX2. It is intended for global and continental climate monitoring, climate change detection and attribution studies and climate model evaluation. Twenty-nine indices, including daily maximum and minimum temperatures, number of frost days, maximum 1…
Main variables and Earth System components
Atmosphere Air Temperature at 2m Maximum Air Temperature Minimum Air Temperature Land Freeze/ThawExperts contributing reviews
- Dunn, Robert
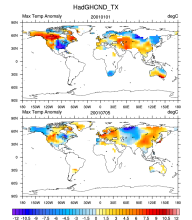 HadGHCNDEX - Gridded Daily Temperature Extremes
Years of record
- to
HadGHCND (aka HadGHCNDEX) is a gridded daily dataset of near-surface maximum (TX) and minimum (TN) temperature observations. Anomalies (departures from 1961-1990 climatology) and actual temperatures are distributed in two separate files. The dataset is designed primarily for the analysis of climate extremes and also for climate model evaluation. It spans the years 1950…
Main variables and Earth System components
Atmosphere Maximum Air Temperature Minimum Air TemperatureExperts contributing reviews
- N/A
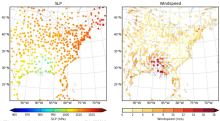 HadISD: Sub-daily, non-interpolated weather station data
Years of record
- to
HadISD ("Hadley Centre Integrated Surface Database") is a compendium of subdaily weather-station data developed by the UK Met Office that is based on NOAA NCEI's Integrated Surface Database but with various quality-control checks implemented to remove stations with excessive and obvious typographical or instrumental errors, as well as individual occurrences of these…
Main variables and Earth System components
Atmosphere Air Temperature at 2m Dew Point Temperature Precipitation Sea Level Pressure Storm data WindExperts contributing reviews
- Raymond, Colin
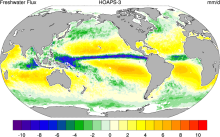 HOAPS: Hamburg Ocean Atmosphere Parameters and Fluxes from Satellite Data
Years of record
- to
The Hamburg Ocean Atmosphere Parameters and Fluxes from Satellite Data (HOAPS) set is a satellite-based climatology of precipitation, evaporation and freshwater budget (evaporation minus precipitation) as well as related turbulent heat fluxes and atmospheric state variables over the global ice free oceans. All variables are derived from SSM/I passive microwave…
Main variables and Earth System components
Atmosphere Evaporation Evaporation-Precipitation Precipitation Radiation Specific Humidity Wind Latent & sensible heat flux Precipitable water Ocean SST - sea surface temperature-
Formats
- netCDF
-
Timestep
- Climatology, Sub-daily, Monthly, Pentad
-
Domain
- Global
-
Collections
- Boundary Conditions
Experts contributing reviews
- N/A
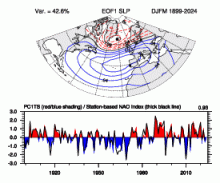 Hurrell North Atlantic Oscillation (NAO) Index (PC-based)
Years of record
- to
The principal component (PC)-based indices of the North Atlantic Oscillation (NAO) are the time series of the leading Empirical Orthogonal Function (EOF) of SLP anomalies over the Atlantic sector, 20°-80°N, 90°W-40°E. These indices are used to measure the NAO throughout the year, tracking the seasonal movements of the Icelandic low and Azores high. These movements…
-
Formats
- ascii
-
Timestep
- Monthly, Seasonal, Annual
-
Domain
- Atlantic Ocean
-
Collections
- Climate Analysis Section (CAS) Data Catalog
Experts contributing reviews
- Hurrell, James, Phillips, Adam
 Hurrell North Atlantic Oscillation (NAO) Index (station-based)
Years of record
- to
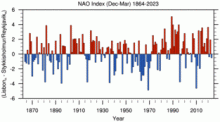
The winter (December thru March) station-based index of the NAO is based on the difference of normalized sea level pressure (SLP) between Lisbon, Portugal and Stykkisholmur/Reykjavik, Iceland since 1864. Positive values of the NAO index are typically associated with stronger-than-average westerlies over the middle latitudes, more intense weather systems over…
-
Formats
- ascii
-
Timestep
- Monthly, Seasonal, Annual
-
Domain
- Atlantic Ocean
-
Collections
- Climate Analysis Section (CAS) Data Catalog
Experts contributing reviews
- Hurrell, James, Phillips, Adam
 Hurrell wintertime SLP-based Northern Annular Mode (NAM) Index
Years of record
- to
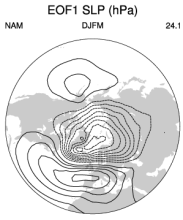
The NAM (or Arctic Oscillation) is defined as the first EOF of NH (20°-90°N) winter SLP data. It explains 23% of the extended winter mean (December-March) variance, and it is clearly dominated by the NAO structure in the Atlantic sector. Although there are some subtle differences from the NAO regional pattern over the Atlantic and Arctic (see Figure 1 below), the main…
-
Formats
- ascii
-
Timestep
- Seasonal
-
Collections
- N/A
Experts contributing reviews
- Phillips, Adam
 IBTrACS: Tropical cyclone best track data
Years of record
- N/A
IBTrACS (International Best Track Archive for Climate Stewardship) provides global tropical cyclone best track data in a centralized location to aid our understanding of the distribution, frequency, and intensity of tropical cyclones worldwide. The World Meteorological Organization Tropical Cyclone Programme has endorsed IBTrACS as an official archiving and distribution…
Experts contributing reviews
- Schreck, Carl
 ICOADS Surface Marine Weather Observations
Years of record
- N/A
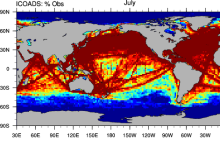
ICOADS (International Comprehensive Ocean-Atmosphere Data Set) is the most comprehensive archive of global marine surface climate observations available. Variables include SST, SLP, air temperature, wind speed, cloud amount, and others. There is no processing beyond initial quality control. ICOADS data are packaged in several different formats with different time periods…
Main variables and Earth System components
Atmosphere Air Temperature Budget Cloud Properties Latent & sensible heat flux Sea Level Pressure Specific Humidity Wind Ocean SST - sea surface temperatureExperts contributing reviews
- Deser, Clara
 IMERG precipitation algorithm and the Global Precipitation Measurement (GPM) Mission
Years of record
- to
IMERG (Integrated Multi-satellitE Retrievals for the Global Precipitation Measurement) is NASA's updated precipitation algorithm, while the Global Precipitation Measurement (GPM) mission is an international satellite mission launched by NASA and JAXA on Feb. 27, 2014. The GPM is a follow on to the TRMM satellite mission. NASA have applied the IMERG algorithm to both TRMM…
Experts contributing reviews
- Huffman, George J., Tan, Jackson
 Integrated Global Radiosonde Archive (IGRA)
Years of record
- to
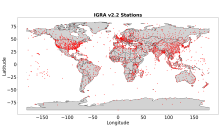
The largest publicly available collection of quality-controlled, globally-distributed, historical radiosonde and pilot balloon observations is the Integrated Global Radiosonde Archive (IGRA; Durre et al. 2006, 2018). First released in 2004, IGRA is maintained and distributed by NOAA’s National Centers for Environmental Information (NCEI). IGRA v2.2, which was released in…
Main variables and Earth System components
Atmosphere Dew Point Temperature Geopotential Height Multiple variables Relative Humidity WindExperts contributing reviews
- Durre, Imke, Korzeniewski, Bryant
 ISCCP: International Satellite Cloud Climatology Project
Years of record
- to
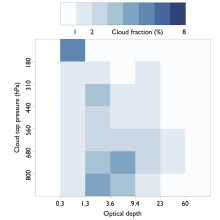
The International Satellite Cloud Climatology Project (ISCCP) makes use of routine observations by operational weather satellites to provide a long-term (1983-2009), gridded, global record of cloud properties. ISCCP uses observations in the visible and infrared window portions of the spectrum to determine cloud optical thickness and cloud top temperature, from which the…
-
Timestep
- Climatology, Sub-daily, Monthly
-
Domain
- Global
Experts contributing reviews
- Pincus, Robert
 Japanese Ocean Flux Data sets with Use of Remote Sensing Observations (J-OFURO2)
Years of record
- to
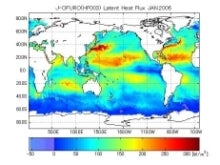
These ocean surface flux data sets are derived primarily using data from multiple satellites. The COARE 3.0 bulk algorithm [Fairall et al. (2003)] is used in J-OFURO2 for the estimation of sensible and latent heat fluxes.
Main variables and Earth System components
Atmosphere Specific Humidity Wind Stress Latent & sensible heat flux Ocean Surface FluxExperts contributing reviews
- N/A
 JRA-55
Years of record
- to
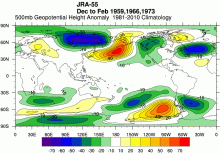
Spanning 1958-present, JRA-55 is the longest third-generation reanalysis that uses the full observing system (in contrast, products like ERA-20C and NOAA 20CR assimilate a very limited set of observations while NCEP R1 uses an antiquated model and assimilation scheme). Compared to the previous generation Japanese Meteorological Agency (JMA) reanalysis, JRA-25, JRA-…
Main variables and Earth System components
Atmosphere Air Temperature Geopotential Height Precipitable waterExperts contributing reviews
- Kobayashi, Shinya
 Lightning data from the TRMM and ISS Lightning Image Sounder (LIS): Towards a global lightning Climate Data Record
Years of record
- to
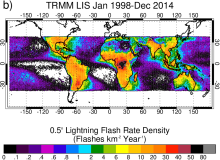
The Lightning Imaging Sensor (LIS) is an optically based spaceborne lightning detection instrument that has been hosted on two different platforms – the Tropical Rainfall Measuring Mission satellite (TRMM; 1998-2015; Kummerow et al. 1998) and the International Space Station (ISS; 2017-present; Blakeslee et al. 2020). Relative to TRMM LIS, which covered ±38 latitude, ISS…
Experts contributing reviews
- Lang, Timothy
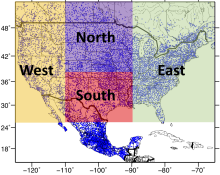 Livneh gridded precipitation and other meteorological variables for continental US, Mexico and southern Canada
Years of record
- to
The Livneh et al. (2015) hydrometeorological dataset consists of gridded daily and monthly precipitation, maximum and minimum air temperature, and wind speed for the continental US, southern Canada, and Mexico for the period 1950-2013. Gridded at 1/16° horizontal resolution (~ 6km), the data have been used as training data for GCM downscaling, as validation for numerical…
Main variables and Earth System components
Atmosphere Maximum Air Temperature Minimum Air Temperature Precipitation Wind-
Formats
- netCDF
-
Timestep
- Daily, Monthly
-
Domain
- North America
-
Collections
- N/A
Experts contributing reviews
- Livneh, Ben
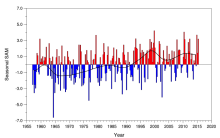 Marshall Southern Annular Mode (SAM) Index (Station-based)
Years of record
- to
The station-based index of the Southern Annular Mode (SAM) is based on the zonal pressure difference between the latitudes of 40S and 65S. As such, the SAM index measures a "see-saw" of atmospheric mass between the middle and high latitudes of the Southern Hemisphere. Positive values of the SAM index correspond with stronger-than-average westerlies over the…
-
Formats
- ascii
-
Timestep
- N/A
-
Collections
- N/A
Experts contributing reviews
- Marshall, Gareth
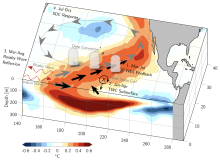 Meridional Modes and their indices
Years of record
- N/A
In each of the world’s tropical ocean basins, year-to-year climate variability is primarily governed by fluctuations in the zonal sea surface temperature (SST) gradient and zonal surface winds. These variations consist of recognizable climate modes, such as the El Niño-Southern Oscillation (ENSO) in the tropical Pacific and Atlantic Niño in the tropical Atlantic. While…
-
Formats
- N/A
-
Timestep
- N/A
-
Domain
- Atlantic Ocean, Pacific Ocean
-
Collections
- N/A
Experts contributing reviews
- Amaya, Dillon
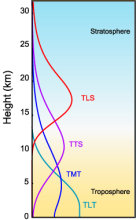 MSU/AMSU Atmospheric Temperature Climate Data Record, Remote Sensing Systems (RSS)
Years of record
- to
A long (30-year+) data set of atmospheric temperatures for 4 tropopsheric and lower stratopsheric layers has been derived from brightness temperatures measured by the Microwave Sounding Unit (MSU) and Advanced Microwave Sounding Unit (AMSU). This page describes the data sets developed by Remote Sensing Systems (RSS); other options exist for comparisons. One of the most…
-
Timestep
- Monthly
-
Domain
- Global
-
Collections
- Climate Data Record
Experts contributing reviews
- Mears, Carl
 NASA MERRA
Years of record
- to
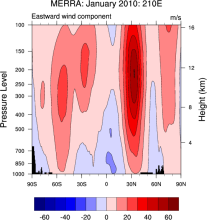
The Modern Era Retrospective-Analysis for Research and Applications (MERRA) was undertaken by NASA’s Global Modeling and Assimilation Office with two primary objectives: to place observations from NASA’s Earth Observing System satellites into a climate context and to improve upon the hydrologic cycle represented in earlier generations of reanalyses. MERRA was generated…
Main variables and Earth System components
Atmosphere Air Temperature Geopotential Height Precipitable water Water Vapor-
Timestep
- Sub-daily, Monthly
-
Domain
- Global
Experts contributing reviews
- N/A
 NASA's MERRA2 reanalysis
Years of record
- to
The Modern-Era Retrospective analysis for Research and Applications, version 2 (MERRA-2) is a global atmospheric reanalysis produced by the NASA Global Modeling and Assimilation Office (GMAO). It spans the satellite observing era from 1980 to the present. The goals of MERRA-2 are to provide a regularly-gridded, homogeneous record of the global atmosphere, and to…
Main variables and Earth System components
Atmosphere Aerosols Air Temperature Geopotential Height Precipitable waterExperts contributing reviews
- Bosilovich, Michael, Cullather, Richard
 NCAR Sea Level Pressure
Years of record
- to
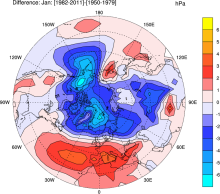
NCAR Sea Level Pressure is a gridded analysis of SLP based on land station reports, covering 1899 to present for latitudes 30°N-90°N. Quality controlled raw data plus empirical corrections for changes in instrumentation and station location.
-
Timestep
- N/A
-
Domain
- NH - Northern Hemisphere
-
Collections
- Climate Analysis Section (CAS) Data Catalog
Experts contributing reviews
- Hurrell, James, Trenberth, Kevin
 NCEP NARR
Years of record
- to
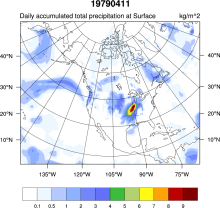
A high resolution (32km x 29 pressure levels) data set focused upon the North American Region. Relative to the NCEP-DOE (R2) it has a much improved land-hydrology, diurnal cycle and land-atmosphere interaction. As such, it can be considered a second generation reanalysis. A unique feature is the direct assimilation of observed precipitation.
Main variables and Earth System components
Atmosphere Air Temperature Geopotential Height Precipitable water Land-
Formats
- GRIB
-
Timestep
- Climatology, Sub-daily, Monthly
-
Domain
- North America
-
Collections
- N/A
Experts contributing reviews
- N/A
 NCEP-NCAR (R1): An Overview
Years of record
- to
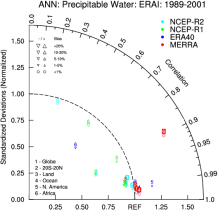
NCEP-NCAR (R1) is the original reanalysis effort. It uses a frozen global state-of-the-art global data assimilation system (as of 11 January 1995). The original database was enhanced (additional, quality checked datasets) by NCAR's Data Support Section. Originally planned to span 1957-96 ("40-Year Reanalysis Project"), it was extended back to 1948 and continues to this…
-
Timestep
- Sub-daily, Daily, Monthly
-
Domain
- Global
Experts contributing reviews
- N/A
 NLDAS: North American Land Data Assimilation System
Years of record
- to
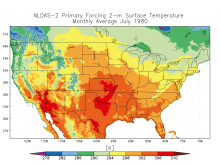
The North American Land Data Assimilation System (NLDAS) integrates a large quantity of observation-based and model reanalysis data to produce long-term hourly atmospheric forcing data, and then uses this meteorological data to drive offline (not coupled to the atmosphere) land-surface and/or hydrological models. The spatial resolution of NLDAS is at 1/8th-degree…
Main variables and Earth System components
Atmosphere Air Temperature CAPE Evaporation Precipitation Radiation Specific Humidity Surface Pressure Wind-
Timestep
- Climatology, Sub-daily, Monthly
-
Domain
- North America
-
Collections
- N/A
Experts contributing reviews
- Xia, Youlong, Mocko, David
 NOAA 20th-Century Reanalysis, Version 2 and 2c
Years of record
- to
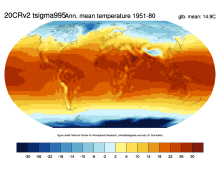
The Twentieth Century Reanalysis (20CR) provides a comprehensive global atmospheric circulation data set spanning 1850-2014. Its chief motivation is to provide an observational validation data set, with quantified uncertainties, for assessing climate model simulations of the 20th century, with emphasis on the statistics of daily weather. The analyses are generated by…
-
Timestep
- Sub-daily, Daily, Monthly
-
Domain
- Global
Experts contributing reviews
- N/A
 NOAA ThreadEx Long-term Station Extremes for America
Years of record
- to
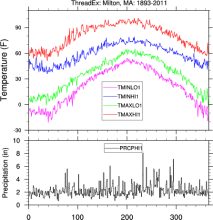
ThreadEx is a data set of extreme daily temperature and precipitation values for 270 locations in the United States. For each day of the year at each station, ThreadEx provides the top 3 record high and low daily maximum temperatures, the top 3 record high and low daily minimum temperatures, the top 3 daily precipitation totals, along with the years the records were set…
Main variables and Earth System components
Atmosphere Air Temperature Maximum Air Temperature Minimum Air Temperature Precipitation-
Formats
- ascii
-
Timestep
- Daily
-
Domain
- North America
-
Collections
- N/A
Experts contributing reviews
- N/A
 North Pacific (NP) Index by Trenberth and Hurrell; monthly and winter
Years of record
- to
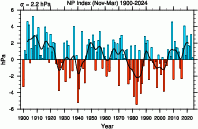
The North Pacific Index (NP index or NPI) is the area-weighted sea level pressure over the region 30°N-65°N, 160°E-140°W. The NP index is defined to measure interannual to decadal variations in the atmospheric circulation. The dominant atmosphere-ocean relation in the North Pacific is one where atmospheric changes lead changes in sea surface temperatures by one to two…
-
Formats
- ascii
-
Timestep
- Monthly, Seasonal
-
Collections
- Climate Analysis Section (CAS) Data Catalog
Experts contributing reviews
- Hurrell, James, Phillips, Adam
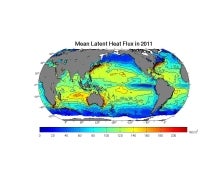 OAFlux: Objectively Analyzed air-sea Fluxes for the global oceans.
Years of record
- to
"The OAFlux project aims to provide consistent, multi-decade, global analysis of air-sea heat, freshwater (evaporation), and momentum fluxes for use in studies of global energy budget, water cycle, atmosphere and ocean circulation, and climate. The OAFlux project is so called because it applies objective analysis approach to take into account data errors in the…
Main variables and Earth System components
Atmosphere Latent & sensible heat flux Radiation Wind Ocean SST - sea surface temperature Surface Flux wind stress curlExperts contributing reviews
- N/A
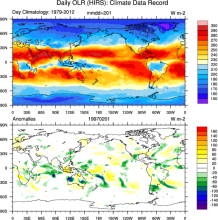 Outgoing Longwave Radiation (OLR): HIRS
Years of record
- to
"The new Climate Data Record (CDR) provides daily global climate data that are valuable as inputs into Radiation Budget Studies and verifying numerical models and can identify the variations in tropical clouds and rainfall that drive global weather patterns. The daily climate data of OLR can provide radiance observations at a 1.0x1.0 Degree resolution, creating…
-
Formats
- netCDF
-
Timestep
- Daily, Monthly
-
Domain
- Global
-
Collections
- Climate Data Record
Experts contributing reviews
- N/A
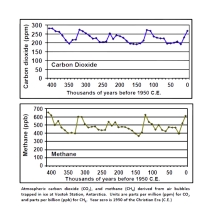 Overview: Carbon Dioxide (CO2) Data Sets
Years of record
- to
Directly measured and continuous records of atmospheric carbon dioxide (CO2) extend back to 1958. CO2 has also been measured in ancient air samples trapped in ice cores, and these records extend back hundreds of thousands of years. More recently, CO2 is being sampled by satellites providing global data to researchers.
-
Formats
- ascii
-
Timestep
- Daily, Monthly, Annual
-
Domain
- N/A
-
Collections
- Boundary Conditions, Carbon cycle, Overview / Comparison page
Experts contributing reviews
- N/A
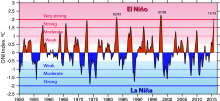 Overview: Climate Indices
Years of record
- N/A
A climate index is a simple diagnostic quantity that is used to characterize an aspect of a geophysical system such as a circulation pattern. A variety of methods have been used to derive assorted indices. Classically, selected station, grid point or regional average data have been used (eg., Southern Oscillation Index, Nino 3.4). Other indices are based upon empirical…
-
Formats
- N/A
-
Timestep
- N/A
-
Domain
- N/A
-
Collections
- Overview / Comparison page
Experts contributing reviews
- N/A
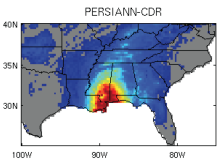 PERSIANN-CDR: Precipitation Estimation from Remotely Sensed Information using Artificial Neural Networks - Climate Data Record
Years of record
- to
The Precipitation Estimation from Remotely Sensed Information using Artificial Neural Networks- Climate Data Record (PERSIANN-CDR) provides daily rainfall estimates at a spatial resolution of 0.25 degrees in the latitude band 60S - 60N from 1983 to the near-present. The precipitation estimate is produced using the PERSIANN algorithm on GridSat-B1 infrared…
-
Timestep
- Sub-daily, Daily
-
Domain
- Global
-
Collections
- Climate Data Record
Experts contributing reviews
- Ashouri, Hamed, Gehne, Maria
 Precipitation Data Sets: Overview & Comparison table
Years of record
- N/A
Precipitation (rain, snow, hail, ...) is one of the key components of the hydrological cycle. Its societal importance cannot be over stated. For climate research, precipitation is one of the key terms for balancing the energy budget, and one of the most challenging aspects of climate modeling. Hence, high quality estimates of precipitation's distribution, amounts and…
-
Formats
- N/A
-
Timestep
- N/A
-
Domain
- N/A
-
Collections
- Overview / Comparison page
Experts contributing reviews
- N/A
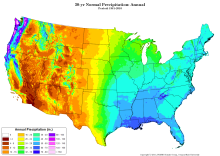 PRISM High-Resolution Spatial Climate Data for the United States: Max/min temp, dewpoint, precipitation
Years of record
- to
PRISM is a set of monthly, yearly, and single-event gridded data products of mean temperature and precipitation, max/min temperatures, and dewpoints, primarily for the United States. In-situ point measurements are ingested into the PRISM (Parameter elevation Regression on Independent Slopes Model) statistical mapping system. The PRISM products use a weighted regression…
Main variables and Earth System components
Atmosphere Dew Point Temperature Maximum Air Temperature Minimum Air Temperature Precipitation-
Formats
- ARC/INFO ASCII GRID, netCDF
-
Timestep
- Climatology, Daily, Monthly
-
Domain
- North America
-
Collections
- N/A
Experts contributing reviews
- Daly, Christopher
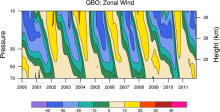 QBO: Quasi-Biennial Oscillation
Years of record
- to
The quasi-biennial oscillation (QBO) is a quasi-periodic oscillation of the equatorial zonal wind between easterlies and westerlies in the tropical stratosphere with a mean period of 28 to 29 months. The alternating wind regimes develop at the top of the lower stratosphere and propagate downwards at about 1 km (0.6 mi) per month until they are dissipated at the tropical…
Experts contributing reviews
- N/A
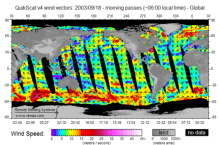 QuikSCAT: near sea-surface wind speed and direction
Years of record
- to
The QuikSCAT mission was intended to obtain sea-surface wind speed and direction data under all weather and cloud conditions over Earth's oceans. SeaWinds, an active radar scatterometer, is the main instrument on the QuikSCAT satellite. The microwave backscatter measured by SeaWinds is dependent on the surface roughness of the ocean, which in turn is related to wind…
Experts contributing reviews
- Ricciardulli, Lucrezia
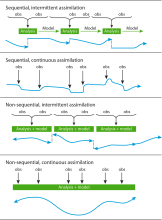 Simplistic Overview of Reanalysis Data Assimilation Methods
Years of record
- N/A
Data assimilation is the process of combining observations from a wide variety of sources and forecast output from a weather prediction model. The resulting analysis is considered to be the 'best' estimate of the state of the atmosphere at a particular instant in time. The process of combining the observational and model information is accomplished within a Bayesian…
Main variables and Earth System components
Atmosphere-
Formats
- N/A
-
Timestep
- N/A
-
Domain
- N/A
-
Collections
- N/A
Experts contributing reviews
- N/A
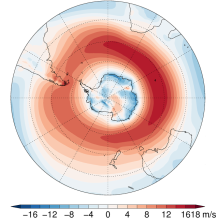 Southern Hemisphere westerly jet strength and position
Years of record
- to
The dynamics of the Southern Hemisphere westerly jet are described in terms of two indices, jet strength and jet latitude. Here, these indices are defined using the ERA-Interim reanalysis, although other datasets, including climate models, could be used. Although closely linked with the Southern Annular Mode (SAM) Index, these indices more precisely capture…
-
Formats
- ascii
-
Timestep
- Seasonal, Annual
-
Collections
- N/A
Experts contributing reviews
- Bracegirdle, Thomas J.
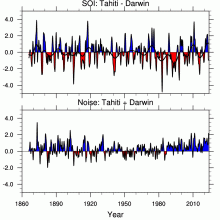 Southern Oscillation Indices: Signal, Noise and Tahiti/Darwin SLP (SOI)
Years of record
- to
The Southern Oscillation Index (SOI) is a time series used to characterize the large scale sea level pressure (SLP) patterns in the tropical Pacific. Monthly mean SLP at Tahiti [T] and Darwin [D] are used. An optimal SOI can be constructed. It consists of [T-D] which is a measure of the large scale phenomena while [T+D] is a measure of small scale and/or…
-
Timestep
- Monthly
-
Domain
- Australia, Pacific Ocean, Tropics
-
Collections
- Climate Analysis Section (CAS) Data Catalog
Experts contributing reviews
- Trenberth, Kevin
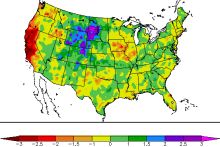 Standardized Precipitation Index (SPI)
Years of record
- to
The Standardized Precipitation Index (SPI) is a widely used index to characterize meteorological drought on a range of timescales. On short timescales, the SPI is closely related to soil moisture, while at longer timescales, the SPI can be related to groundwater and reservoir storage. The SPI can be compared across regions with markedly different climates. It quantifies…
-
Formats
- N/A
-
Timestep
- Monthly
-
Domain
- N/A
-
Collections
- N/A
Experts contributing reviews
- Keyantash, John
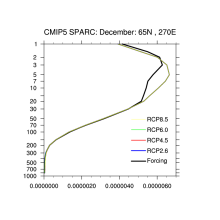 Stratospheric & Tropospheric Ozone: ACC/SPARC (Atmospheric Chemistry and Climate / Stratospheric Processes and their Role in Climate)
Years of record
- to
"The AC&C/SPARC ozone database covers the period 1850 to 2100 and can be used as forcing in climate models that do not include interactive chemistry. The historical part of the AC&C/SPARC ozone database spans the period 1850 to 2009 and consists of separate stratospheric and tropospheric data sources: (1) A multiple linear regression analysis of SAGE I+II…
-
Formats
- netCDF
-
Timestep
- Monthly
-
Domain
- Global
-
Collections
- Boundary Conditions, CMIP5-recommended, AC&C/SPARC ozone
Experts contributing reviews
- N/A
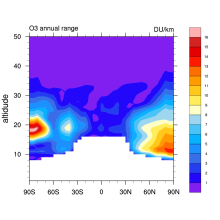 Stratospheric Ozone: Randel & Wu 2007
Years of record
- to
This is a monthly, zonal-mean ozone profile data set spanning 1979–2005 for altitudes from the tropopause up to 50 km. Interannual variability is based on a combination of SAGE (Stratospheric Aerosol and Gas Experiment) satellite profile measurements and polar ozonesondes. The interannual anomalies were added to a climatology from Fortuin and Kelder (1998). …
-
Formats
- binary
-
Timestep
- Monthly
-
Domain
- Global
-
Collections
- Boundary Conditions
Experts contributing reviews
- Randel, Bill
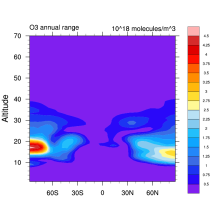 Stratospheric Ozone: Vertically Resolved, zonal mean based on BDBP
Years of record
- to
Combined monthly mean vertical ozone profile database spanning the period 1979 to 2007. The database is completely filled such that there are no missing data. The raw individual ozone data are sourced from the BDBP database. Monthly means are calculated from individual ozone measurements extracted from the BDBP in much the same way as in Hassler et al. (2009). Five…
Experts contributing reviews
- Hassler, Birgit
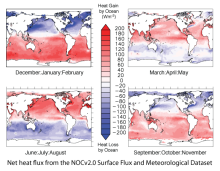 Surface Flux and Meteorological Dataset: National Oceanography Centre (NOC) V2.0
Years of record
- to
The National Oceanography Centre (NOC) Version 2.0 Surface Flux and Meteorological Dataset is a monthly mean gridded dataset of marine surface measurements and derived fluxes constructed using optimal interpolation. Input for the period 1973 to 2006 are ICOADS Release 2.4 ship data and the update from 2007 to 2014 uses ICOADS Release 2.5. The dataset is presented…
-
Formats
- netCDF
-
Timestep
- Monthly
-
Domain
- Global
-
Collections
- Climate Data Record
Experts contributing reviews
- Kent, Elizabeth
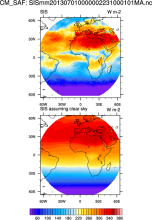 Surface Solar Radiation Data Set - Heliosat (SARAH) -Edition 1
Years of record
- to
"The Surface Solar Radiation Data Set - Heliosat (SARAH) is a satellite-based climatology of the solar surface irradiance (SIS), the surface direct normalized irradiance (DNI) and the effective cloud albedo (CAL) derived from satellite observations of the visible channels of the MVIRI and SEVIRI instruments onboard the geostationary Meteosat satellites. The data are…
-
Formats
- netCDF
-
Timestep
- Sub-daily, Daily, Monthly
-
Collections
- Climate Data Record
Experts contributing reviews
- N/A
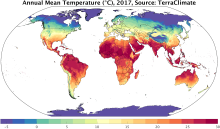 TerraClimate: Global, high-resolution gridded temperature, precipitation, and other water balance variables
Years of record
- to
TerraClimate is a global gridded dataset of meteorological and water balance variables for 1958-present, available on a monthly timestep. Its relatively fine spatial resolution, global extent, and long length are a unique combination that fills a void in climate data. TerraClimate combines spatial climatology from WorldClim with time-varying information from the…
Main variables and Earth System components
Atmosphere Air Temperature Maximum Air Temperature Minimum Air Temperature Potential Evapotranspiration Precipitation Wind Snow Water Equivalent Land evapotranspiration Runoff and Streamflow Soil MoistureExperts contributing reviews
- Abatzoglou, John
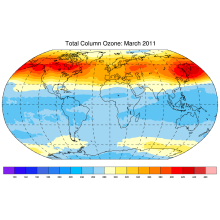 Total Column Ozone: Bodeker Scientific
Years of record
- N/A
Bodeker Scientific produces global, daily, total column ozone database by combining measurements from a number of different satellite-based instruments. Offsets and drifts between the different datasets are resolved through comparisons with the Dobson and Brewer ground-based instruments and through inter-satellite instrument comparisons. Three versions with different…
Experts contributing reviews
- N/A
 Total Solar Irradiance (TSI) datasets: An overview
Years of record
- to
The solar radiation arriving at Earth (once known as the “solar constant”, now usually referred to as Total Solar Irradiance (TSI)), is the most fundamental of climate parameters as it indicates the totality of the energy driving the climate system. All climate models need to prescribe a value for it, either explicitly or implicitly, but its measurement with the…
-
Formats
- N/A
-
Timestep
- N/A
-
Domain
- Global
-
Collections
- N/A
Experts contributing reviews
- Ball, William, Haigh, Joanna
 TRMM: Tropical Rainfall Measuring Mission
Years of record
- to
The Tropical Rainfall Measuring Mission (TRMM) is a joint space mission between NASA and Japan's National Space Development Agency designed to monitor and study tropical and subtropical precipitation and the associated release of energy. The mission uses 5 instruments: Precipitation Radar (PR), TRMM Microwave Imager (TMI), Visible Infrared Scanner (VIRS), Clouds &…
-
Timestep
- Sub-daily, Daily, Monthly
-
Domain
- Tropics
-
Collections
- Climate Analysis Section (CAS) Data Catalog, Obs4MIPS
Experts contributing reviews
- Huffman, George J., Pendergrass, Angeline
 Tropical Moored Buoy System: TAO, TRITON, PIRATA, RAMA (TOGA)
Years of record
- to
The Tropical Ocean Global Atmosphere program (TOGA) is a component of the World Climate Research Programme (WCRP) aimed specifically at the prediction of climate phenomena on time scales of months to years. In order to achieve the TOGA goals, a strategy of large-scale, long-term monitoring of the upper ocean and the atmosphere has been developed. In particular, several…
Main variables and Earth System components
Atmosphere Air Temperature Precipitation Radiation Relative Humidity Sea Level Pressure Wind Ocean Absolute Dynamic Topography (ADT) Ocean Heat Content SST - sea surface temperature Salinity Sub Surface Salinity Sub Surface Temperature u, v current componentsExperts contributing reviews
- N/A
 U.S. Climate Extremes Index (CEI)
Years of record
- to
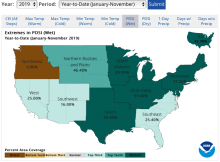
The U.S. Climate Extremes Index (CEI) was first presented in 1995 as a framework for quantifying observed changes in climate within the contiguous United States. At present, the CEI evaluates the percent area of extremes in the distribution of much above/below average (top/bottom 10% of occurrence) temperatures, precipitation, drought, and tropical cyclone wind…
Main variables and Earth System components
Atmosphere Air Temperature Maximum Air Temperature Minimum Air Temperature Precipitation Wind Land Drought-
Formats
- ascii
-
Timestep
- Monthly, Seasonal, Annual
-
Domain
- North America
-
Collections
- N/A
Experts contributing reviews
- Gleason, Karin
 WASWind: Wave and Anemometer-based Sea Surface Wind
Years of record
- to
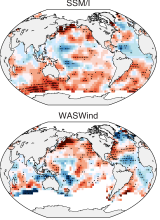
"WASWind (Wave and Anemometer-based Sea Surface Wind) provides a bias-corrected marine surface wind dataset over the global oceans. Variables include scalar, zonal and meridional winds at 10-meter high, and zonal and meridional components of wind stress. WASWind has been constructed from wind observations in ICOADS (International Comprehensive Ocean-Atmosphere Data Set)…
Experts contributing reviews
- Tokinaga, Hiroki
 Water Isotopes from Satellites
Years of record
- to
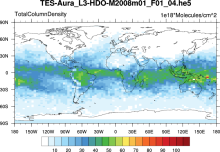
Summary of 7 satellite-derived products providing a global snapshot of water isotope distribution in 3D, with good information on zonal gradients and seasonality.
Experts contributing reviews
- Risi, Camille