Climate data guide content with tag Overview / Comparison page
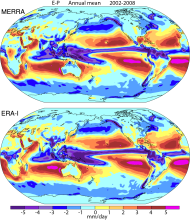 Atmospheric Reanalysis: Overview & Comparison Tables
Years of record
- N/A
Reanalysis a systematic approach to produce data sets for climate monitoring and research. Reanalyses are created via an unchanging ("frozen") data assimilation scheme and model(s) which ingest all available observations every 6-12 hours over the period being analyzed. This unchanging framework provides a dynamically consistent estimate of the climate state at each time…
Main variables and Earth System components
Atmosphere-
Formats
- N/A
-
Timestep
- N/A
-
Domain
- N/A
Experts contributing reviews
- Dee, Dick, Fasullo, John, Shea, Dennis, Walsh, John
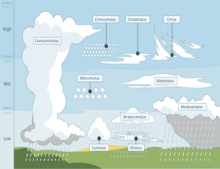 Cloud Dataset Overview
Years of record
- to
Clouds cover about 70% of the earth's surface. They are important components of the cliimate's water and energy budgets. Historically, cloud reports have come from station or ship observations. The satellite observation era, beginning in the 1980’s and spanning now more than 30 years, allows to capture clouds and their properties over the entire globe and across a…
-
Formats
- N/A
-
Timestep
- Climatology, Monthly
-
Domain
- Global
-
Collections
- Overview / Comparison page
Experts contributing reviews
- Stubenrauch, Claudia
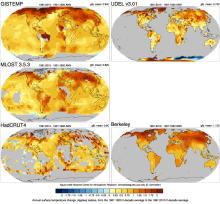 Global Temperature Data Sets: Overview & Comparison Table
Years of record
- to
Global surface temperature data sets are an essential resource for monitoring and understanding climate variability and climate change. The most commonly used data sets combine historical observations of near surface air temperatures at land stations with global data sets of sea surface temperatures (SST) obtained from a changing mix of ship-based and buoy measurements.…
Main variables and Earth System components
Atmosphere Air Temperature Air Temperature at 2m Ocean SST - sea surface temperature-
Timestep
- Climatology, Monthly
-
Domain
- Global
-
Collections
- Overview / Comparison page
Experts contributing reviews
- N/A
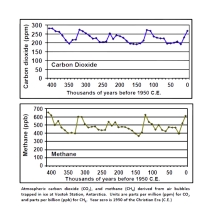 Overview: Carbon Dioxide (CO2) Data Sets
Years of record
- to
Directly measured and continuous records of atmospheric carbon dioxide (CO2) extend back to 1958. CO2 has also been measured in ancient air samples trapped in ice cores, and these records extend back hundreds of thousands of years. More recently, CO2 is being sampled by satellites providing global data to researchers.
-
Formats
- ascii
-
Timestep
- Daily, Monthly, Annual
-
Domain
- N/A
-
Collections
- Boundary Conditions, Carbon cycle, Overview / Comparison page
Experts contributing reviews
- N/A
 Overview: Climate Indices
Years of record
- N/A
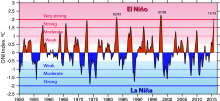
A climate index is a simple diagnostic quantity that is used to characterize an aspect of a geophysical system such as a circulation pattern. A variety of methods have been used to derive assorted indices. Classically, selected station, grid point or regional average data have been used (eg., Southern Oscillation Index, Nino 3.4). Other indices are based upon empirical…
-
Formats
- N/A
-
Timestep
- N/A
-
Domain
- N/A
-
Collections
- Overview / Comparison page
Experts contributing reviews
- N/A
 Precipitation Data Sets: Overview & Comparison table
Years of record
- N/A
Precipitation (rain, snow, hail, ...) is one of the key components of the hydrological cycle. Its societal importance cannot be over stated. For climate research, precipitation is one of the key terms for balancing the energy budget, and one of the most challenging aspects of climate modeling. Hence, high quality estimates of precipitation's distribution, amounts and…
-
Formats
- N/A
-
Timestep
- N/A
-
Domain
- N/A
-
Collections
- Overview / Comparison page
Experts contributing reviews
- N/A
 Sea Ice Concentration data: Overview, Comparison table and graphs
Years of record
- N/A
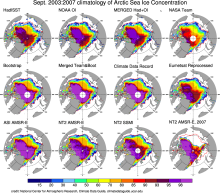
Sea ice concentration is both an indicator and driver of high-latitude climate change with strong societal and ecological importance. It is a key boundary condition for atmospheric models (including those used in atmospheric reanalyses) and a benchmark for coupled climate models. As such, numerous methods have been developed to estimate sea ice concentration. The most…
-
Formats
- N/A
-
Timestep
- N/A
-
Collections
- Overview / Comparison page
Experts contributing reviews
- N/A
 Sea Ice Thickness Data Sets: Overview & Comparison Table
Years of record
- to
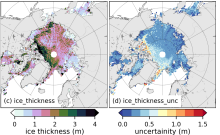
While satellite observations of sea ice extent and concentration are available from 1979, long-term high quality (daily and high spatial resolution) observations of sea ice thickness remain limited as a result of few satellite and in situ observations. Reconstructions using numerous observational sources show a 65% decline in annual mean sea ice thickness in the central…
Experts contributing reviews
- Labe, Zachary, Tilling, Rachel
 Soil Moisture Data Sets: Overview & Comparison Tables
Years of record
- N/A
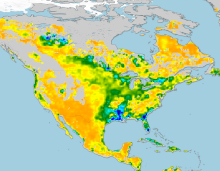
Soil moisture is a state variable of the land that crosses the interfaces of several disciplines, including meteorology, hydrology, climatology and ecology. Soil moisture content controls the partitioning of net radiation at the land surface between sensible and latent heat fluxes. This occurs primarily in the subtopics and tropics where rainfall is not abundant, and in…
-
Formats
- N/A
-
Timestep
- N/A
-
Domain
- N/A
-
Collections
- Overview / Comparison page
Experts contributing reviews
- Dirmeyer, Paul
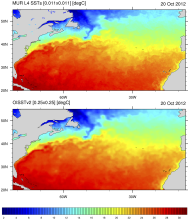 SST Data Sets: Overview & Comparison Table
Years of record
- to
Sea surface temperature (SST) data sets are an essential resource for monitoring and understanding climate variability and climate change. By surface area, SSTs are the dominant (~71%) input into merged global land-ocean surface temperature data products. Historically, SST measurments have been made from ships. Ship data have been compiled into…
-
Formats
- N/A
-
Timestep
- Climatology, Daily, Monthly, Weekly
-
Domain
- Global
-
Collections
- Overview / Comparison page
Experts contributing reviews
- N/A