Hurrell North Atlantic Oscillation (NAO) Index (station-based)

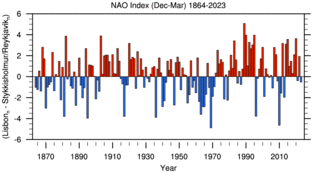
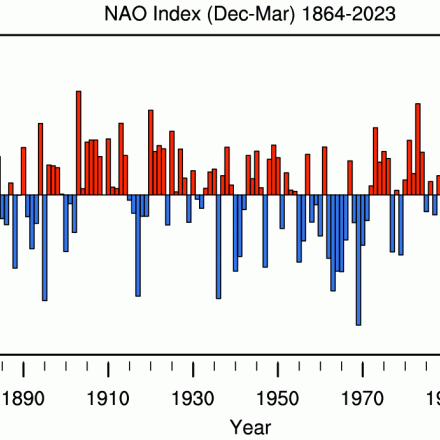
The winter (December thru March) station-based index of the NAO is based on the difference of normalized sea level pressure (SLP) between Lisbon, Portugal and Stykkisholmur/Reykjavik, Iceland since 1864. Positive values of the NAO index are typically associated with stronger-than-average westerlies over the middle latitudes, more intense weather systems over the North Atlantic and wetter/milder weather over western Europe. Monthly, seasonal and annual indices using slightly different data sources for the southern station are also available.
Key Strengths
Station-based indices extend back to the mid-19th century or earlier
Simple to construct and understand
Key Limitations
The stations are fixed in space and thus may not track the movement of the NAO centers of action through the annual cycle
Individual station pressure readings can be noisy due to small-scale and transient meteorological phenomena unrelated to the NAO
- NAO Station-Based Index (Annual)
Missing Value
-999Units
hPaUpdated Through
2022-12-15Next Update
2024-05-15Start Date
1865-01-01File Notes
A test noteCAS Citation
NAO Index Data provided by the Climate Analysis Section, NCAR, Boulder, USA, Hurrell (2003). Updated regularly. Accessed DD Month YYYY [list date you accessed the data]. - NAO Station-Based Index (DJFM)
Missing Value
-999Units
hPaUpdated Through
2023-03-15Next Update
2024-05-15Start Date
1864-01-01File Notes
DJFM NAO Index: The station index value for year N refers to an average of December year N-1 and January, February, and March year N. (Example: The 1999 value contains the average of December 1998 and January, February, and March 1999. DJFM versus Monthly timeseries: The values of the DJFM index are not exactly the same as the average of the individual months of Dec, Jan, Feb and Mar in the monthly index. This is because of the normalization that is done for each index. For the DJFM index, each station's seasonal anomalies are normalized before one station is subtracted from the other. For the monthly index, each station's monthly anomalies are normalized before the stations are subtracted from each other. Thus, one cannot take the monthly DJFM values and average them to get the corresponding DJFM seasonal average value for that year.CAS Citation
NAO Index Data provided by the Climate Analysis Section, NCAR, Boulder, USA, Hurrell (2003). Updated regularly. Accessed DD Month YYYY [list date you accessed the data] - NAO Station-Based Index (Monthly)
Missing Value
-999Units
hPaUpdated Through
2023-06-15Next Update
2024-05-15Start Date
1865-01-01File Notes
DJFM versus Monthly timeseries: The values of the DJFM index are not exactly the same as the average of the individual months of Dec, Jan, Feb and Mar in the monthly index. This is because of the normalization that is done for each index. For the DJFM index, each station's seasonal anomalies are normalized before one station is subtracted from the other. For the monthly index, each station's monthly anomalies are normalized before the stations are subtracted from each other. Thus, one cannot take the monthly DJFM values and average them to get the corresponding DJFM seasonal average value for that year.CAS Citation
NAO Index Data provided by the Climate Analysis Section, NCAR, Boulder, USA, Hurrell (2003). Updated regularly. Accessed DD Month YYYY [list date you accessed the data]. - NAO Station-Based Index (seasonal)
Missing Value
-999Units
hPaUpdated Through
2023-05-15Next Update
2024-05-15Start Date
1865-01-01File Notes
CAS Citation
NAO Index Data provided by the Climate Analysis Section, NCAR, Boulder, USA, Hurrell (2003). Updated regularly. Accessed DD Month YYYY [list date you accessed the data].
Expert Developer Guidance
Since there is no unique way to define the spatial structure of the NAO, it follows that there is no universally accepted index to describe the temporal evolution of the phenomenon. Most modern NAO indices are derived either from the simple difference in surface pressure anomalies between various northern and southern locations, or from the PC time series of the leading (usually regional) EOF of sea level pressure (SLP). Many examples of the former exist, usually based on instrumental records from individual stations near the NAO centers of action, but sometimes from gridded SLP analyses. A major advantage of most of these indices is their extension back to the mid-19th century or earlier.
A disadvantage of station-based indices is that they are fixed in space. Given the movement of the NAO centers of action through the annual cycle, such indices can only adequately capture NAO variability for parts of the year. Moreover, individual station pressures are significantly affected by small-scale and transient meteorological phenomena not related to the NAO and, thus, contain noise.
An advantage of the PC time series approach is that such indices are more optimal representations of the full NAO spatial pattern; yet, as they are based on gridded SLP data, they can only be computed for parts of the 20th century, depending on the data source.
For a more detailed discussion of issues related to the NAO indices and related indices such as the Northern Annular Mode (NAM) and Arctic Oscillation (AO), see Hurrell and Deser (2009) and Hurrell et. al (2003), linked in Key Publications 2 and 3 below.
- James Hurrell, NCAR
Cite this page
Acknowledgement of any material taken from or knowledge gained from this page is appreciated:
Hurrell, James &, Phillips, Adam & National Center for Atmospheric Research Staff (Eds). Last modified "The Climate Data Guide: Hurrell North Atlantic Oscillation (NAO) Index (station-based).” Retrieved from https://climatedataguide.ucar.edu/climate-data/hurrell-north-atlantic-oscillation-nao-index-station-based on 2025-04-08.
Citation of datasets is separate and should be done according to the data providers' instructions. If known to us, data citation instructions are given in the Data Access section, above.
Acknowledgement of the Climate Data Guide project is also appreciated:
Schneider, D. P., C. Deser, J. Fasullo, and K. E. Trenberth, 2013: Climate Data Guide Spurs Discovery and Understanding. Eos Trans. AGU, 94, 121–122, https://doi.org/10.1002/2013eo130001
Key Figures

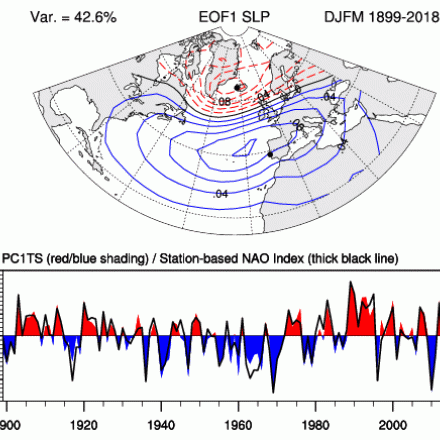
The station based NAO index may not be an optimal representation of the associated spatial pattern. The principal component (PC) time series of the leading EOF of seasonal (December through March) SLP anomalies over the Atlantic sector (20-80N, 90W-40E) serves as an alternative index (Hurrell 1995). The PC based NAO is in color; the station based index is the black line. The correlation is 0.93 over 1899-2018. The black dots on the EOF panel show the location of the stations used for the station-based NAO index. (Climate Data Guide; A. Phillips)
Other Information
Station data from World Monthly Surface Station Climatology
- Hurrell, J.W., 1995: Decadal Trends in the North Atlantic Oscillation: Regional Temperatures and Precipitation. Science: Vol. 269, pp.676-679
- Hurrell, J. W., and C. Deser, 2009: North Atlantic climate variability: The role of the North Atlantic Oscillation. J. Mar. Syst., 78, No. 1, 28-41
- Hurrell et al. (2003) in The North Atlantic Oscillation: Climate Significance and Environmental Impact, Geophysical Monograph 134, American Geophysical Union.
- Trenberth, K.E., and J.W. Hurrell, James W., 1999: Comment on:"The Interpretation of Short Climate Records with Comments on the North Atlantic and Southern Oscillations". Bulletin of the American Meteorological Society: Vol. 80, No. 12, pp.2721-2722
