MJO: Madden-Julian Oscillation Diagnostics

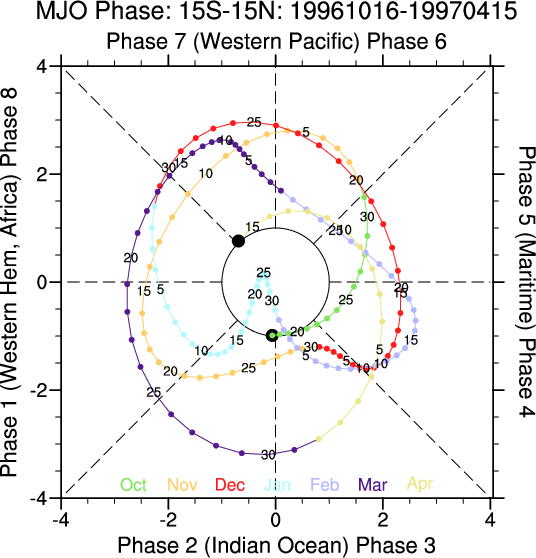
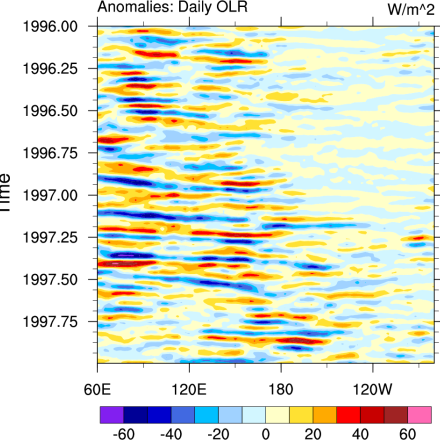
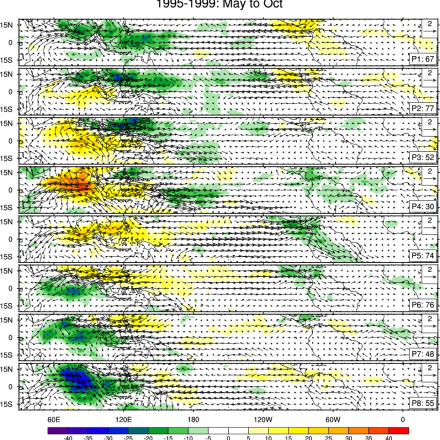
"The Madden–Julian oscillation (MJO) is the largest element of the intraseasonal (30–90 days) variability in the tropical atmosphere. It is a large-scale coupling between atmospheric circulation and tropical deep convection.[1][2] Rather than being a standing pattern (like ENSO) it is a traveling pattern, propagating eastwards at approximately 4 to 8 m/s, through the atmosphere above the warm parts of the Indian and Pacific oceans. This overall circulation pattern manifests itself in various ways, most clearly as anomalous rainfall." (Wikipedia)
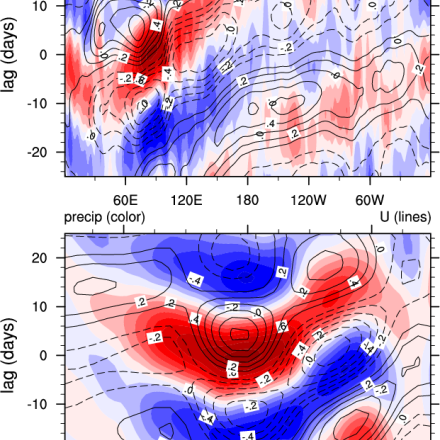
The US-CLIVAR MJO working group has developed diagnostics for objectively evaluating the MJO. Two WWW sites demonstrate the diagnostics: http://www.ncl.ucar.edu/Applications/mjoclivar.shtml and http://climate.snu.ac.kr/mjo_diagnostics/index.htm. Operational centers monitor the MJO and indicies are available at: http://cawcr.gov.au/staff/mwheeler/maproom/RMM/ and http://www.cpc.ncep.noaa.gov/products/precip/CWlink/daily_mjo_index/mjo_...
Cite this page
Acknowledgement of any material taken from or knowledge gained from this page is appreciated:
National Center for Atmospheric Research Staff (Eds). Last modified "The Climate Data Guide: MJO: Madden-Julian Oscillation Diagnostics.” Retrieved from https://climatedataguide.ucar.edu/climate-data/mjo-madden-julian-oscillation-diagnostics on 2025-04-03.
Citation of datasets is separate and should be done according to the data providers' instructions. If known to us, data citation instructions are given in the Data Access section, above.
Acknowledgement of the Climate Data Guide project is also appreciated:
Schneider, D. P., C. Deser, J. Fasullo, and K. E. Trenberth, 2013: Climate Data Guide Spurs Discovery and Understanding. Eos Trans. AGU, 94, 121–122, https://doi.org/10.1002/2013eo130001


